- 您现在的位置:买卖IC网 > Sheet目录486 > NTD15N06L-001 (ON Semiconductor)MOSFET N-CH 60V 15A IPAK
NTD15N06L
in the accompanying graph (Figure 12). Maximum energy at
currents below rated continuous I D can safely be assumed to
equal the values indicated.
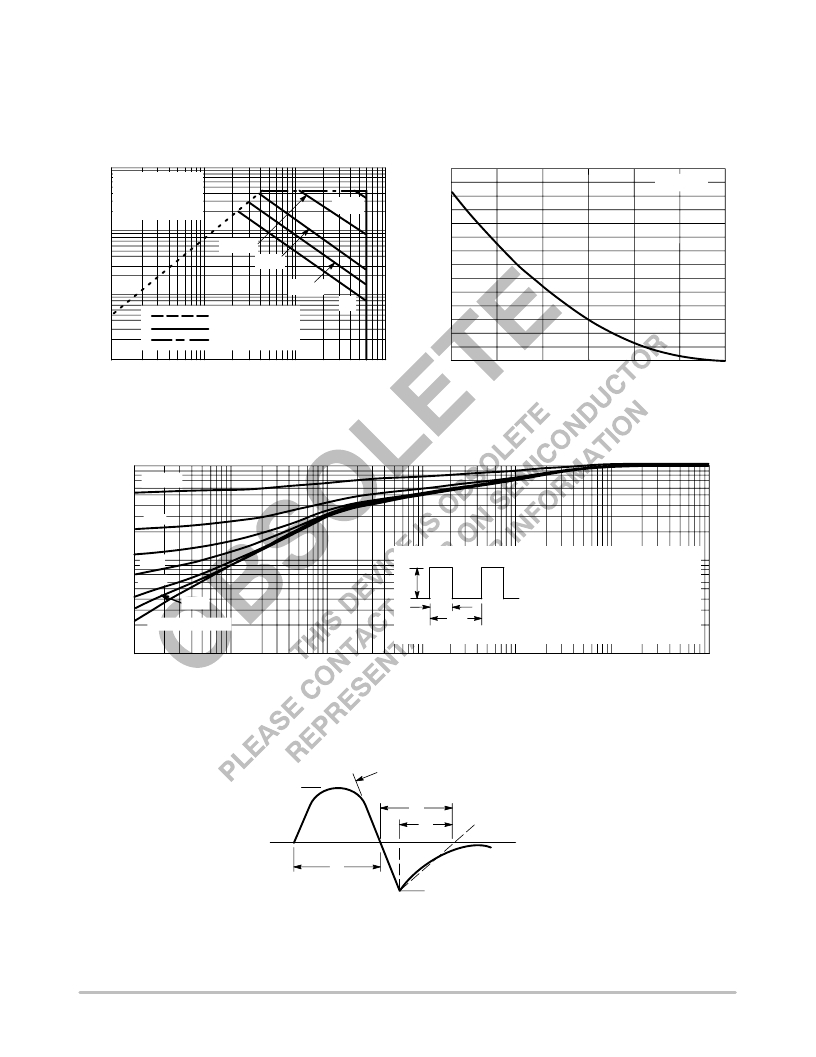
SAFE OPERATING AREA
100
70
10
V GS = 15 V
SINGLE PULSE
T C = 25 ° C
100 m s
1 ms
10 m s
60
50
40
I D = 11 A
1
10 ms
R DS(on) LIMIT
THERMAL LIMIT
PACKAGE LIMIT
dc
30
20
10
0.1
0.1
1
10
100
0
25
50 75 100 125
150
175
V DS , DRAIN ? TO ? SOURCE VOLTAGE (VOLTS)
Figure 11. Maximum Rated Forward Biased
Safe Operating Area
T J , STARTING JUNCTION TEMPERATURE ( ° C)
Figure 12. Maximum Avalanche Energy versus
Starting Junction Temperature
1.0
D = 0.5
0.2
0.1
0.1
0.05
0.02
0.01
SINGLE PULSE
P (pk)
t 1
t 2
DUTY CYCLE, D = t 1 /t 2
R q JC (t) = r(t) R q JC
D CURVES APPLY FOR POWER
PULSE TRAIN SHOWN
READ TIME AT t 1
T J(pk) ? T C = P (pk) R q JC (t)
0.01
0.00001
0.0001
0.001
0.01
0.1
1
10
t, TIME ( m s)
Figure 13. Thermal Response
di/dt
I S
t rr
t p
t a
t b
0.25 I S
TIME
I S
Figure 14. Diode Reverse Recovery Waveform
http://onsemi.com
6
发布紧急采购,3分钟左右您将得到回复。
相关PDF资料
NTD18N06L-001
MOSFET N-CH 60V 18A IPAK
NTD18N06T4G
MOSFET N-CH 60V 18A DPAK
NTD20N03L27-001
MOSFET N-CH 30V 20A IPAK
NTD20N06-001
MOSFET N-CH 60V 20A IPAK
NTD20N06L-001
MOSFET N-CH 60V 20A IPAK
NTD20P06L-001
MOSFET P-CH 60V 15.5A IPAK
NTD23N03R-1G
MOSFET N-CH 25V 3.8A IPAK
NTD24N06-001
MOSFET N-CH 60V 24A IPAK
相关代理商/技术参数
NTD15N06L-1
制造商:ONSEMI 制造商全称:ON Semiconductor 功能描述:Power MOSFET 15 Amps, 60 Volts, Logic Level
NTD15N06L-1G
制造商:Rochester Electronics LLC 功能描述:- Bulk
NTD15N06LG
制造商:ON Semiconductor 功能描述:Trans MOSFET N-CH 60V 15A 3-Pin(2+Tab) DPAK Rail 制造商:Rochester Electronics LLC 功能描述:- Bulk 制造商:ON Semiconductor 功能描述:MOSFET
NTD15N06LT4
功能描述:MOSFET N-CH 60V 15A DPAK RoHS:否 类别:分离式半导体产品 >> FET - 单 系列:- 标准包装:1,000 系列:MESH OVERLAY™ FET 型:MOSFET N 通道,金属氧化物 FET 特点:逻辑电平门 漏极至源极电压(Vdss):200V 电流 - 连续漏极(Id) @ 25° C:18A 开态Rds(最大)@ Id, Vgs @ 25° C:180 毫欧 @ 9A,10V Id 时的 Vgs(th)(最大):4V @ 250µA 闸电荷(Qg) @ Vgs:72nC @ 10V 输入电容 (Ciss) @ Vds:1560pF @ 25V 功率 - 最大:40W 安装类型:通孔 封装/外壳:TO-220-3 整包 供应商设备封装:TO-220FP 包装:管件
NTD15N06LT4G
制造商:Rochester Electronics LLC 功能描述:- Bulk
NTD15N06T4
功能描述:MOSFET N-CH 60V 15A DPAK RoHS:否 类别:分离式半导体产品 >> FET - 单 系列:- 标准包装:1,000 系列:MESH OVERLAY™ FET 型:MOSFET N 通道,金属氧化物 FET 特点:逻辑电平门 漏极至源极电压(Vdss):200V 电流 - 连续漏极(Id) @ 25° C:18A 开态Rds(最大)@ Id, Vgs @ 25° C:180 毫欧 @ 9A,10V Id 时的 Vgs(th)(最大):4V @ 250µA 闸电荷(Qg) @ Vgs:72nC @ 10V 输入电容 (Ciss) @ Vds:1560pF @ 25V 功率 - 最大:40W 安装类型:通孔 封装/外壳:TO-220-3 整包 供应商设备封装:TO-220FP 包装:管件
NTD15N06T4G
制造商:Rochester Electronics LLC 功能描述:- Bulk
NTD15N08/D
制造商:未知厂家 制造商全称:未知厂家 功能描述:80 V Power MOSFET
